

Side-by-side view
In the reconciliation analysis of Turbo AI processes, you choose how records appear: both sides together in a single table, both sides in separate panels, or just one side. Viewing the sources separately helps you find and manually match what automatic reconciliation left unresolved.
Before you start
Side-by-side viewing is available in the reconciliation analysis of Turbo AI processes.
Open the analysis from the process list. This ensures the correct folder and reference date are loaded.
Choose the display mode
Click the Display button above the table and choose one of the four modes:
Single table: both sides in a single table, row by row. Use it to review reconciled pairs.
Side A | Side B: one panel for each side, displayed side by side on the screen.
Side A only: only Side A, occupying the full width.
Side B only: only Side B, occupying the full width.
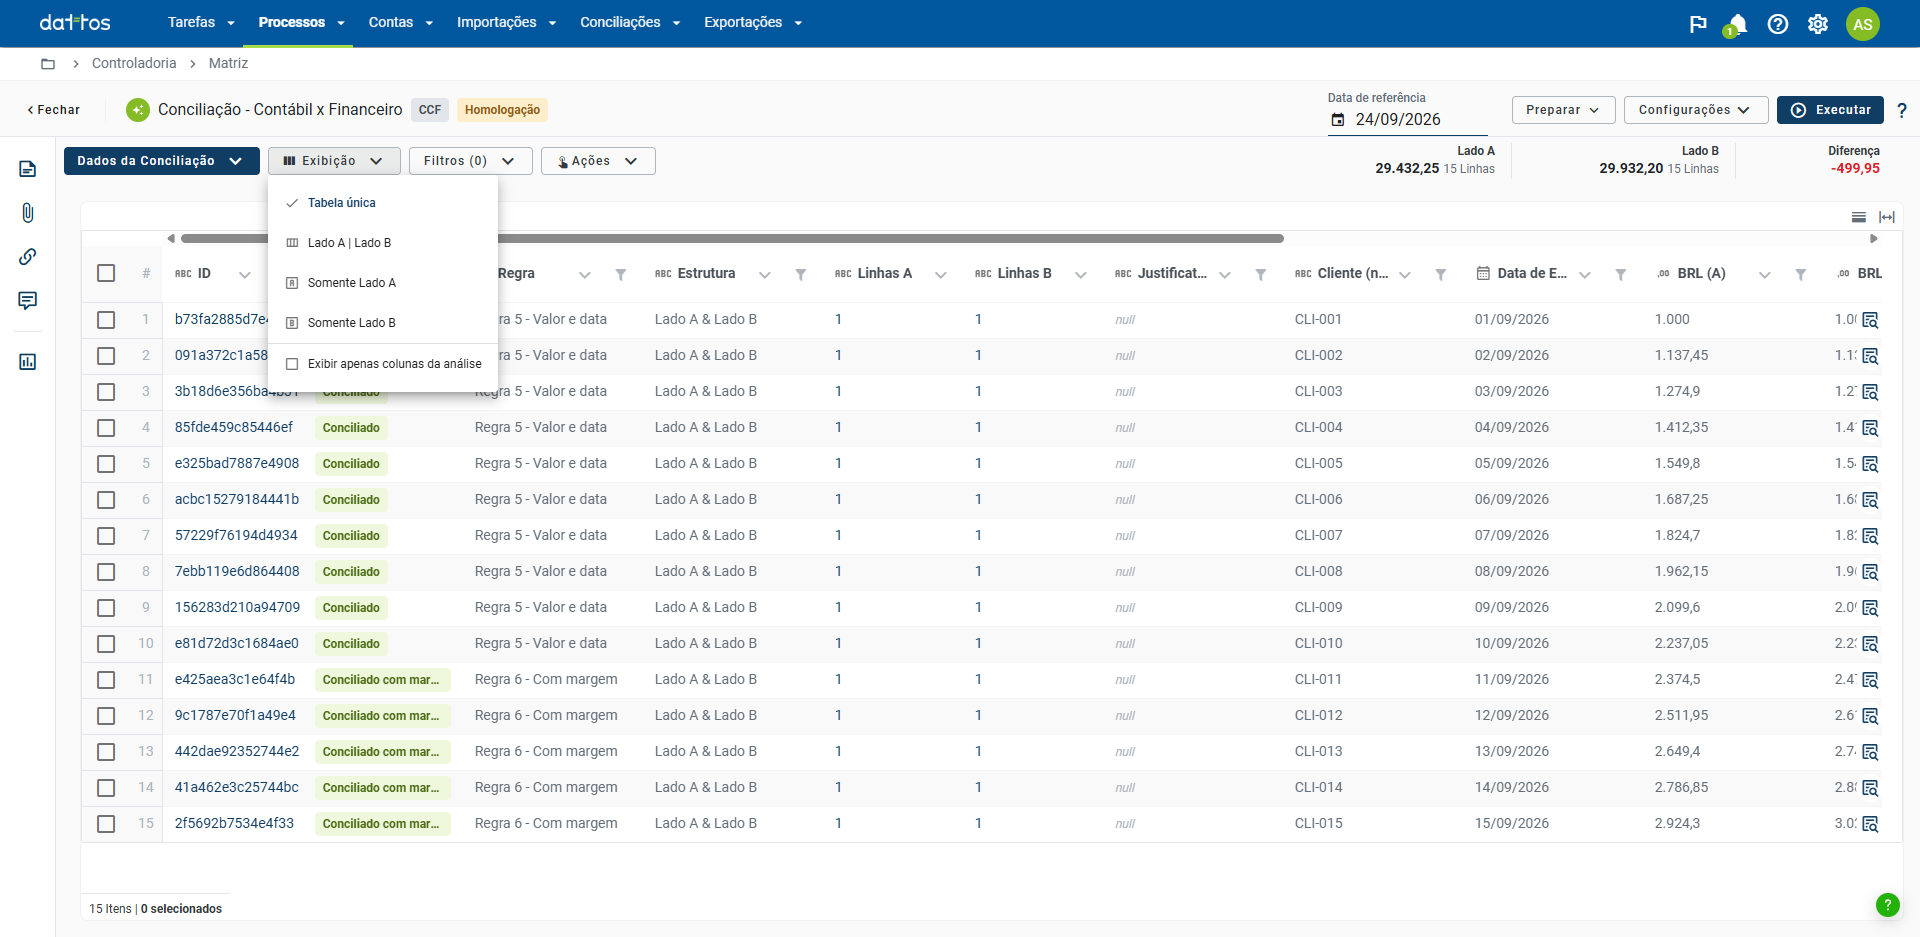
In the same menu, the Show analysis columns only option hides the system's fixed columns and leaves only the columns from your data.
Working with both sides separately
In Side A | Side B mode, each panel works independently: it has its own filter, search, sorting, row counter, and scrolling. For example, you can filter Side A by one criterion and Side B by another, without one affecting the other.
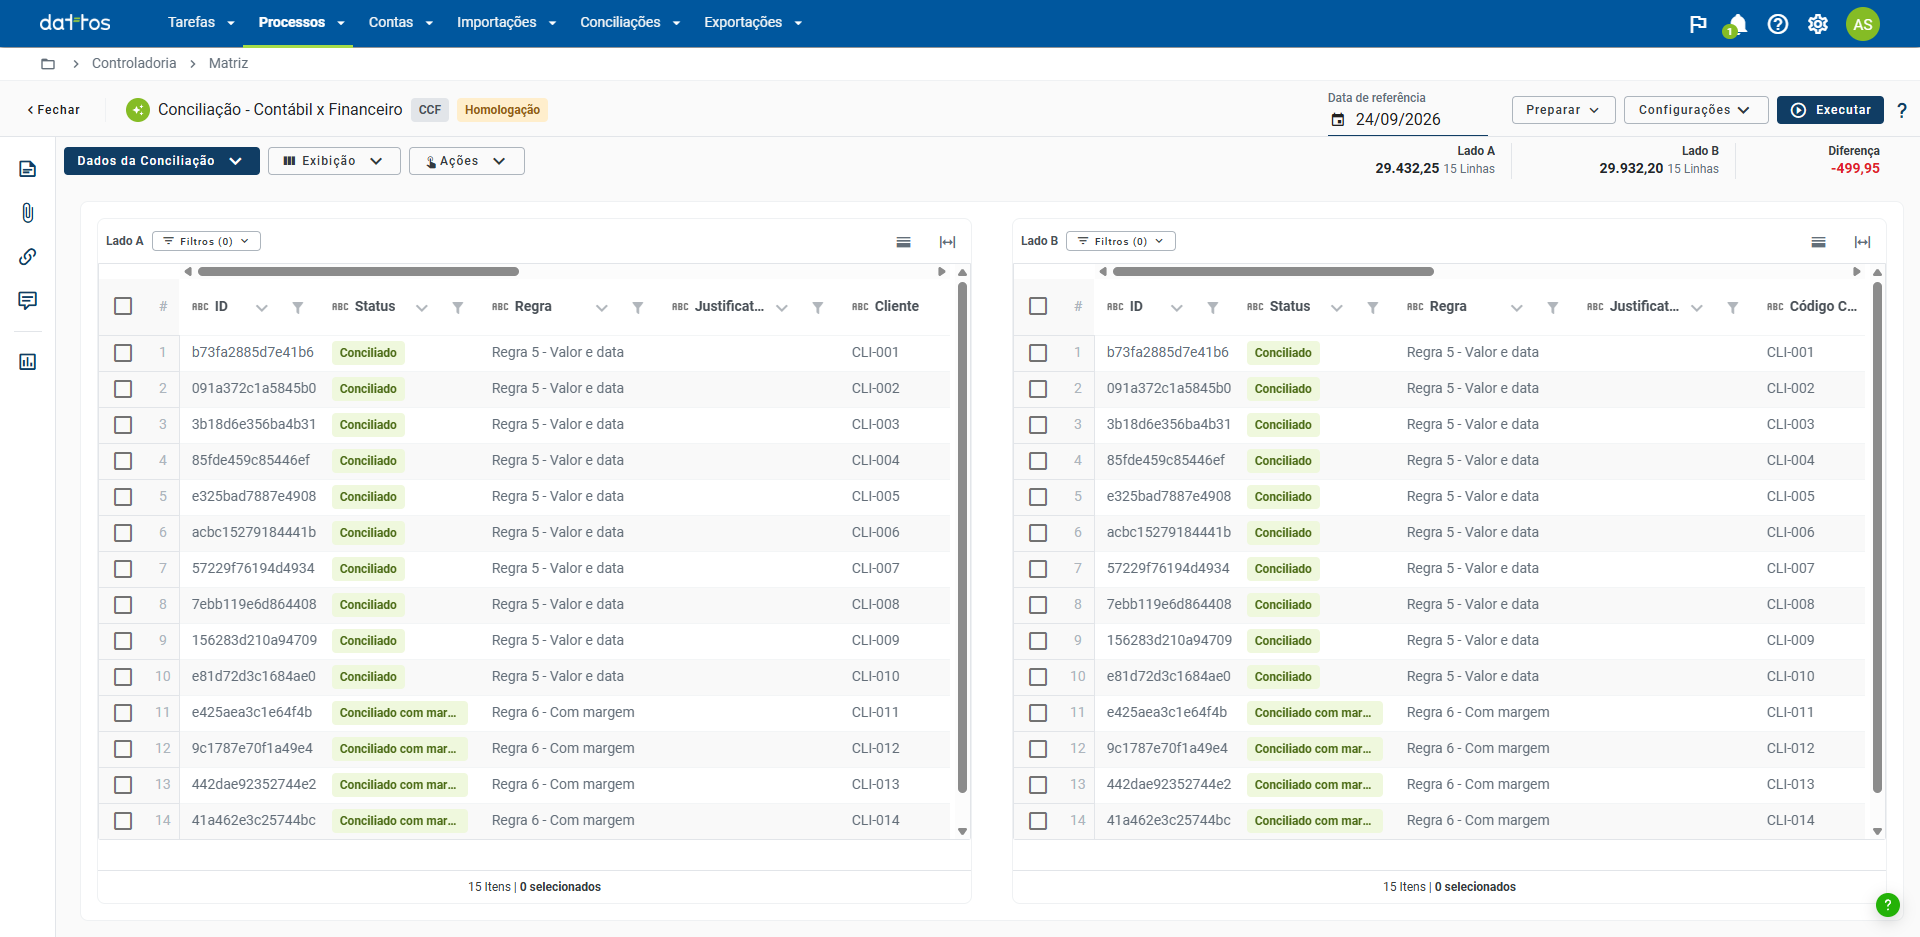
The Side A only and Side B only modes are useful for working with one side in isolation, without the other competing for space on the screen. When you switch modes, the rows you selected remain selected.
Filter by reconciliation status
The Reconciliation statistics panel, in the analysis menu on the left, shows each status (Not found, Reconciled, Reconciled with tolerance, Partially reconciled, Partially reconciled with tolerance, and Manually reconciled) with its value and number of rows. Each status has a toggle that shows or hides those rows, and the filter applies to both sides at the same time.
Totals and row sums
At the top of the analysis, Side A, Side B, and Difference show the total for each side of the reconciliation and the difference between them. These totals cover the entire result: they do not change when you filter the table.
To sum only some of the rows, filter the table using a column's funnel or the Filters button: a bar appears above the table showing the sum for Side A, the sum for Side B, and the difference for the filtered rows, along with the number of rows on each side, without requiring you to select them. If you prefer to choose the rows one by one, select them, and the bar will sum only the selected rows.
Tip: to find out how much falls under each status, use the Reconciliation statistics panel rather than the totals at the top.